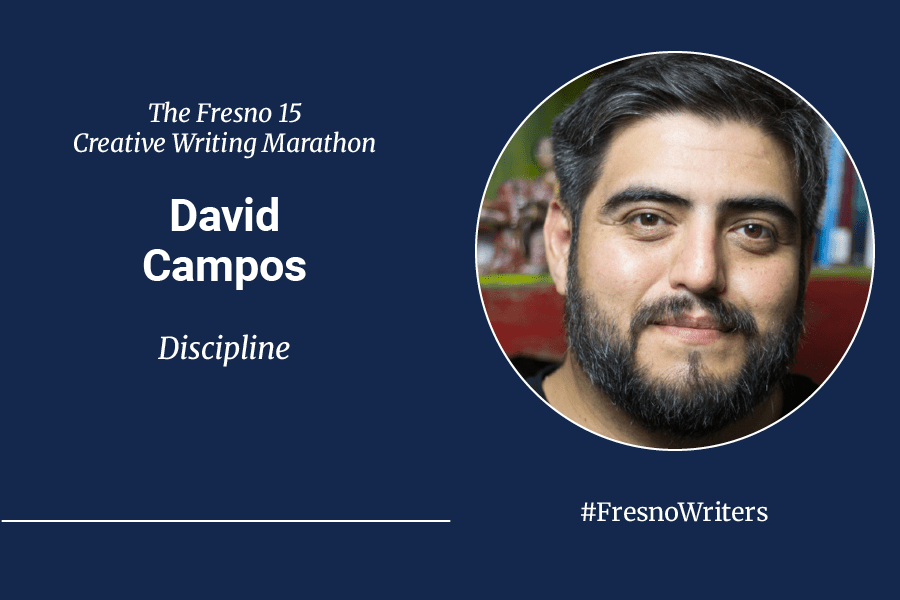
![On top of a charcoal art piece of 4 young black boys is the broken apart map of Fresno Unified’s High School Boundaries. Over the piece of art is the word “Discipline” repeated over and over in different sizes and opacity levels. There is a small epigraph “Black students are 2.5 times more likely to be suspended as White students [in Fresno Unified]”
Each high school boundary has its suspension rates as follows.
Top Left:
Race/Ethnicity Pop. Rate of Suspension
Asian 149 2.5%
Black 271 16.9%
Latinx 1398 9.2%
Pacific
Islander 17 9.5%
Two+ 57 12.5%
White 683 5.2%
Top Right:
Race/Ethnicity Pop. Rate of Suspension
Asian 223 1.7%
Black 202 19.3%
Latinx 1051 8.7%
Pacific
Islander 14 0%
Two+ 46 8.8%
White 255 9.5%
Middle left:
Race/Ethnicity Pop. Rate of Suspension
Asian 149 0%
Black 271 27.2%
Latinx 1398 11.3%
Pacific
Islander 17 Redacted
Two+ 57 18.4%
White 683 13.3%
Middle Right:
Race/Ethnicity Pop. Rate of Suspension
Asian 329 4.7%
Black 87 27.1%
Latinx 1298 7.9%
Pacific
Islander 8 9.1%
Two+ 19 23.8%
White 61 9.6%
Bottom Left:
Race/Ethnicity Pop. Rate of Suspension
Asian 267 1.8%
Black 327 16.7%
Latinx 1 694 6.2%
Pacific
Islander 7 Redacted
Two+ 28 12.1%
White 251 1.9
Bottom center:
Race/Ethnicity Pop. Rate of Suspension
Asian 176 3.7%
Black 114 20.9%
Latinx 1756 6.9%
Pacific
Islander 1 Redacted
Two+ 19 20%
White 77 11.4%
Bottom right:
Race/Ethnicity Pop. Rate of Suspension
Asian 587 3.2%
Black 194 18.3%
Latinx 1973 8.4%
Pacific
Islander 7 Redacted
Two+ 21 17.4%
White 85 10.9%](https://fresnowriters.com/wp-content/uploads/2023/10/disciplineedit10-8.png)
read image description (alt text)
Artist’s Statement: In the article “The Resegregation of Jefferson County,” Nikole Hannah-Jones writes that “since 2000, at least 71 communities across the country, most of them white and wealthy, have sought to break away from their public-school districts to form smaller, more exclusive ones.” This led to research into my state’s segregation and integration efforts. The rhetoric, the maps, and the data were all there—coded language, school boundaries, and even diversity statements covered the stagnant “struggle” toward integration. As an educator, this project provided context for my experience and those of the students in the classroom. Notes and citations will appear at the end of the project.
